Inspection workflow
The audit pipeline records every tool call. The inspection utility is the operator-facing toolset for working with those records: a click-to-expand drawer, a per-event replay, side-by-side comparison, server-side JSONB-path filters, and an NDJSON export. This page is the workflow that ties them together.
What you need
- A running mcp-test instance (
make devor a deployment). - An API key or portal session for the user account that's allowed to read the audit log.
- (Optional, for replay) The MCP server registered in this deployment must still know about the tool you're replaying. Replays of removed tools are refused with
400.
1. Capture a call
The pipeline captures every tools/call automatically when audit.enabled: true (default). Two tables are written in one transaction:
audit_events: indexed summary (timestamp, tool, user, success, duration). Used for browsing and filtering.audit_payloads: full request / response envelope (parameters, headers, response result, response error, notifications, replay linkage). Optional;capture_payloads: falsekeeps the summary only.
To produce a fresh row to inspect, fire any tool. The portal's Try-It page (/portal/tools/<name>) is the easiest way; any MCP client works too.
2. Open the drawer
In the portal, navigate to Audit. Each row in the events table is clickable; the click opens a side drawer with four tabs:
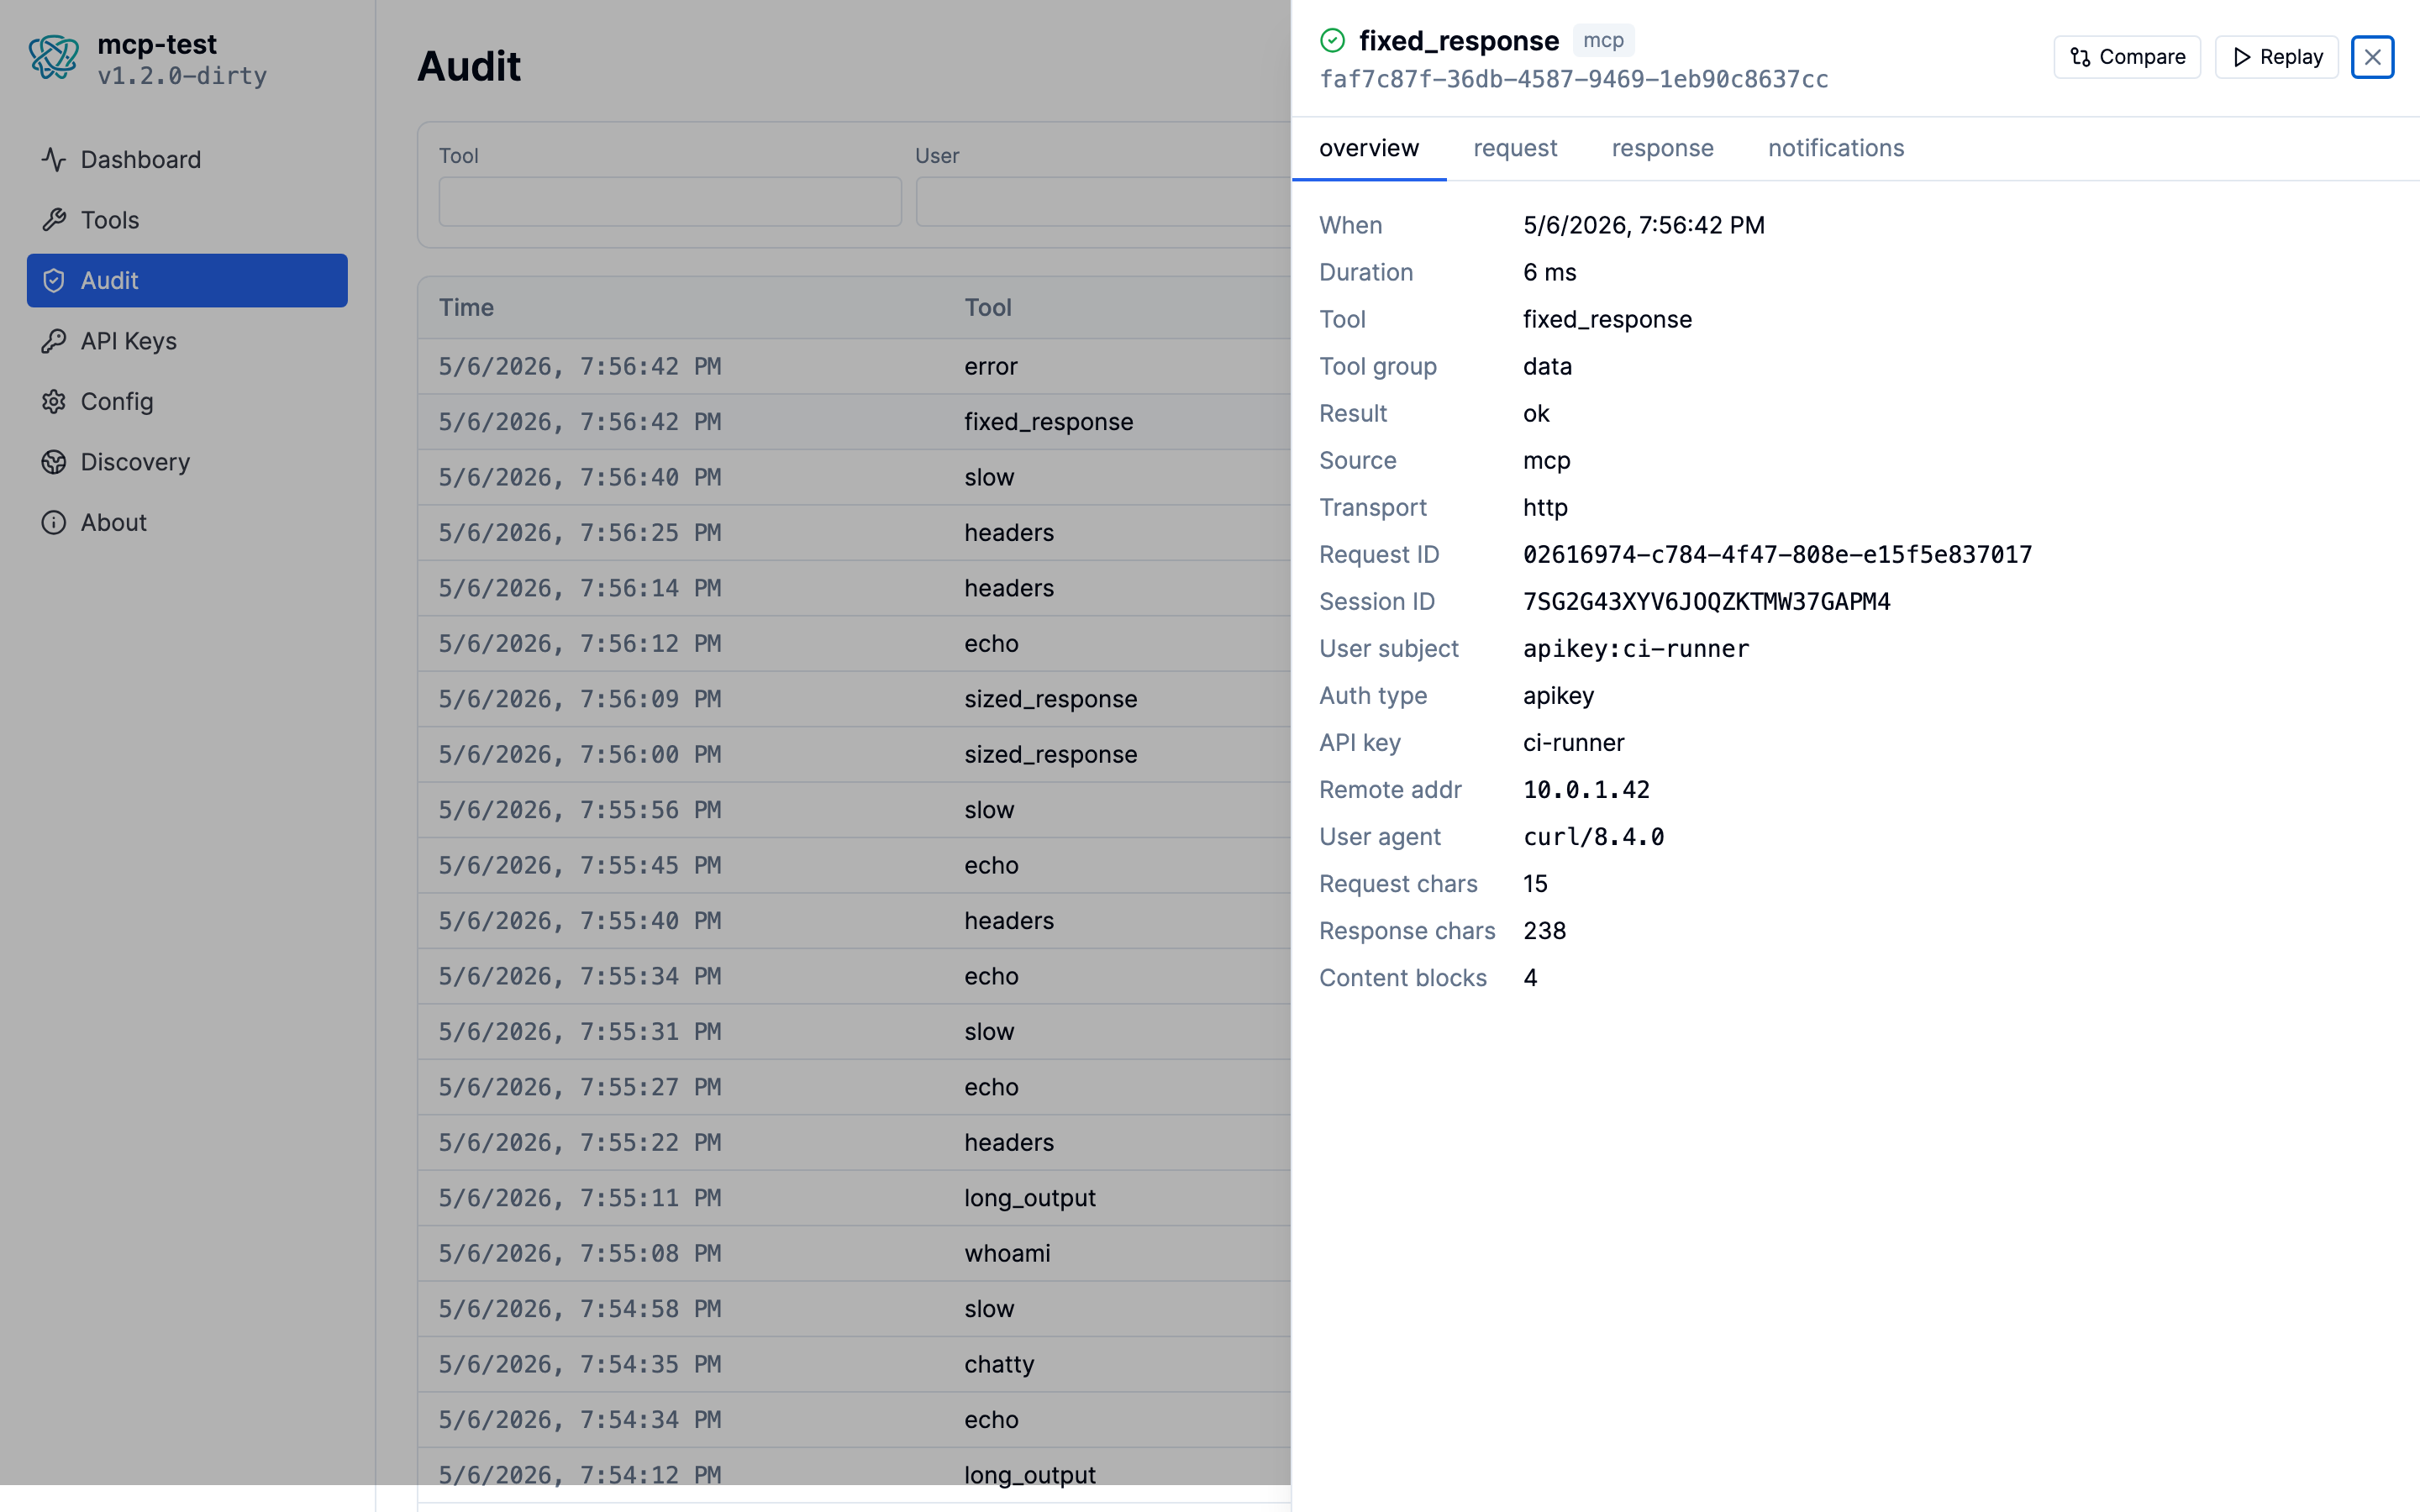
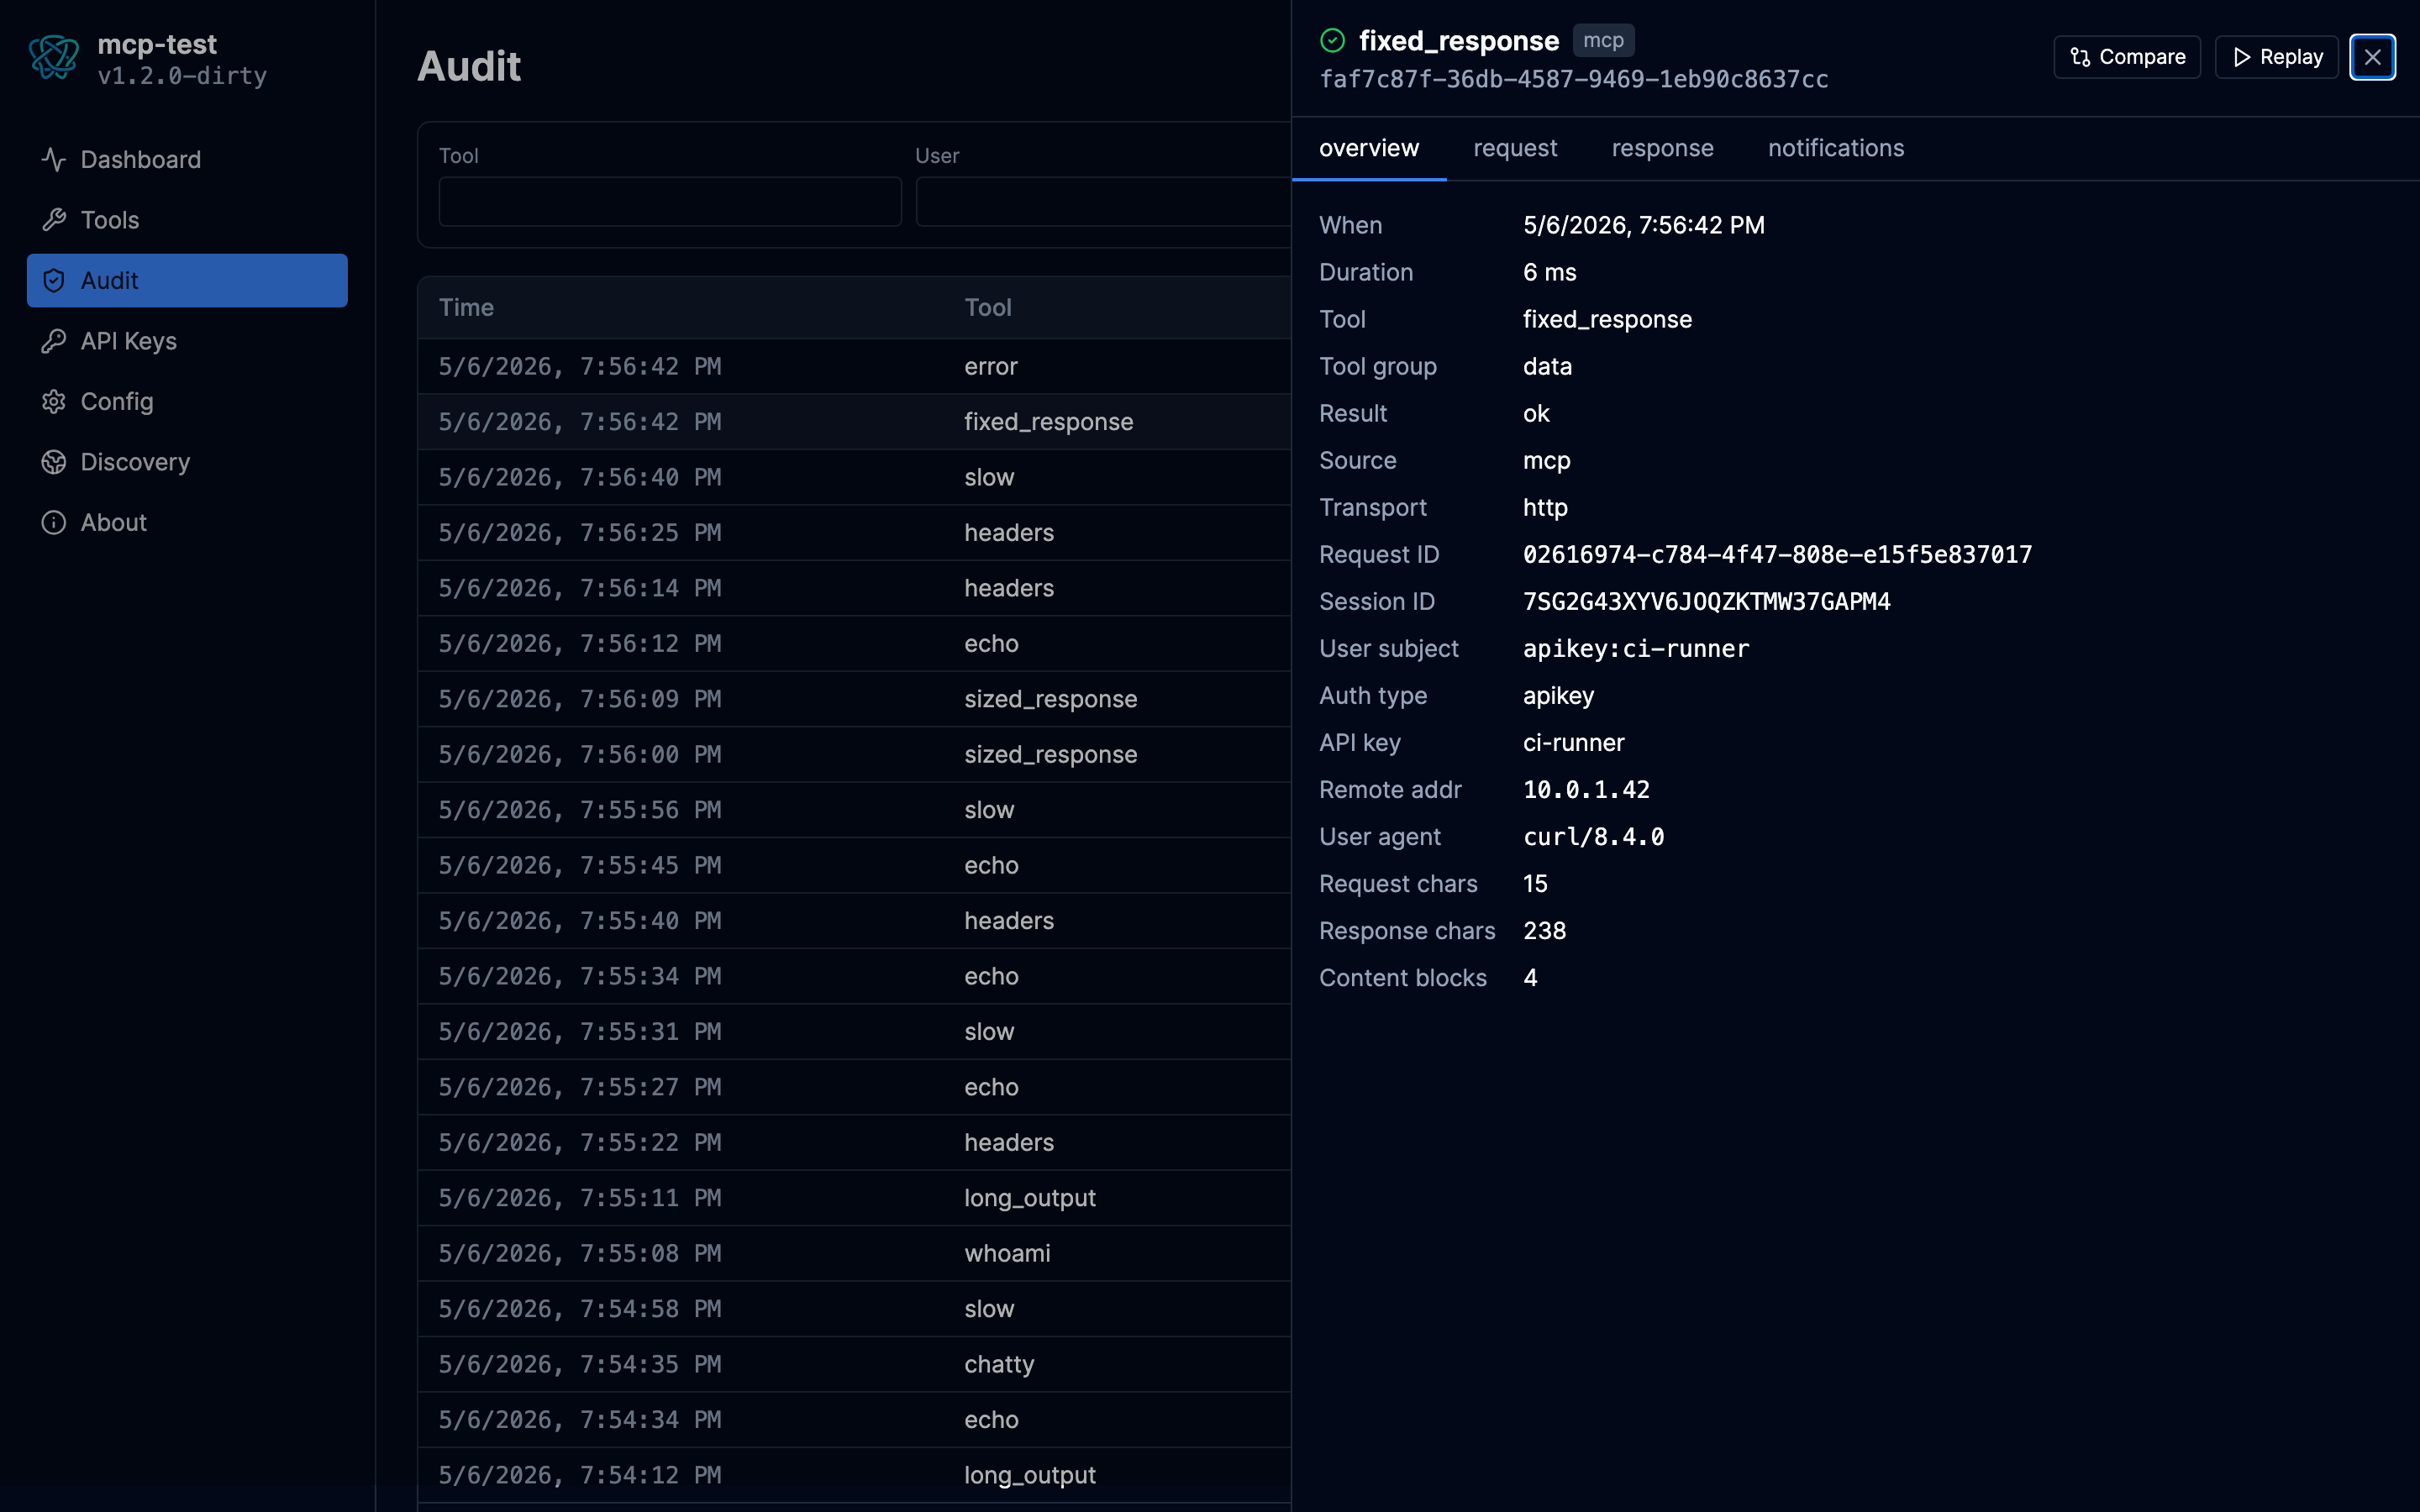
Overview tab
Timing, identity, request id, session id, source (mcp for real client calls, portal-tryit for /admin/tryit invocations, portal-replay for replays), and the replay linkage (Replayed from) when present.
Request tab
The captured request_params (sanitized via audit.redact_keys, with redacted values shown as "[redacted]"). Captured request headers when audit.capture_headers: true; credential-bearing names (Authorization, Cookie, Set-Cookie, Proxy-Authorization, X-API-Key) are stored as "[redacted]" regardless of the redact-keys config; the names remain visible so an operator can confirm "this request carried an Authorization header" without seeing the token. A truncation warning when the request body exceeded audit.max_payload_bytes.
Response tab
The full CallToolResult content blocks (text, image, audio, structured) plus response_error when the call errored. The shape matches what the SDK serializes to the wire so you can see what the client saw. A truncation warning fires when the response body was too large.
Notifications tab
Chronological list of every notifications/* (progress, log message) the tool dispatched during the call window. Each entry is {ts, method, params} with params rendered as JSON. A trim warning fires when the notification list exceeded max_payload_bytes (the trailing entries are missing; the prefix is what's stored).
Drawer interactions:
- The browser URL gets
?id=<event-id>appended so the drawer is deep-linkable; share the URL and the recipient lands on the same row. - The Compare button stashes the open event id in
localStorage. Open another row's drawer and you'll see "Compare with selected"; clicking opens the comparison page with both events. - The Replay button is the next step.
Escand the backdrop close the drawer.
3. Replay a captured call
The drawer's Replay button calls POST /api/v1/portal/audit/events/{id}/replay. The server re-invokes the tool through an in-process MCP client with the same request_params the original call had. A new audit row lands tagged source=portal-replay with replayed_from pointing at the original event; the new event is fired with your identity, not the original caller's, so the audit row reflects who triggered the replay.
The replay banner inside the drawer shows the new event id; clicking it deep-links to that row. Refused replays show a banner explaining why (most common: redacted parameter values, no captured payload, or a tool that's no longer registered).
Replay re-runs side effects. If the original call wrote to a database, sent a notification, or charged a card, the replay does it again. There is no dry-run mode and no per-tool allow list. Treat replay like Try-It: a developer affordance for debugging, not a production self-service. The portal asks for confirmation before firing the request; the disabled-state of the Replay button telegraphs whether the row is replayable at all (it isn't, when the original payload wasn't captured or any param was redacted).
Per-identity rate limit (scoped by API key id or OIDC subject): 5 burst, one token refilled every 12 seconds (sustained 5/min). 429 with Retry-After when exhausted. Tokens are only consumed after validation passes, so clicks on non-replayable rows return 400 without burning the operator's budget.
4. Compare to a baseline
Two events you stashed via the drawer's Compare button can be opened side-by-side at /portal/audit/compare?a=<id>&b=<id>. The page renders:
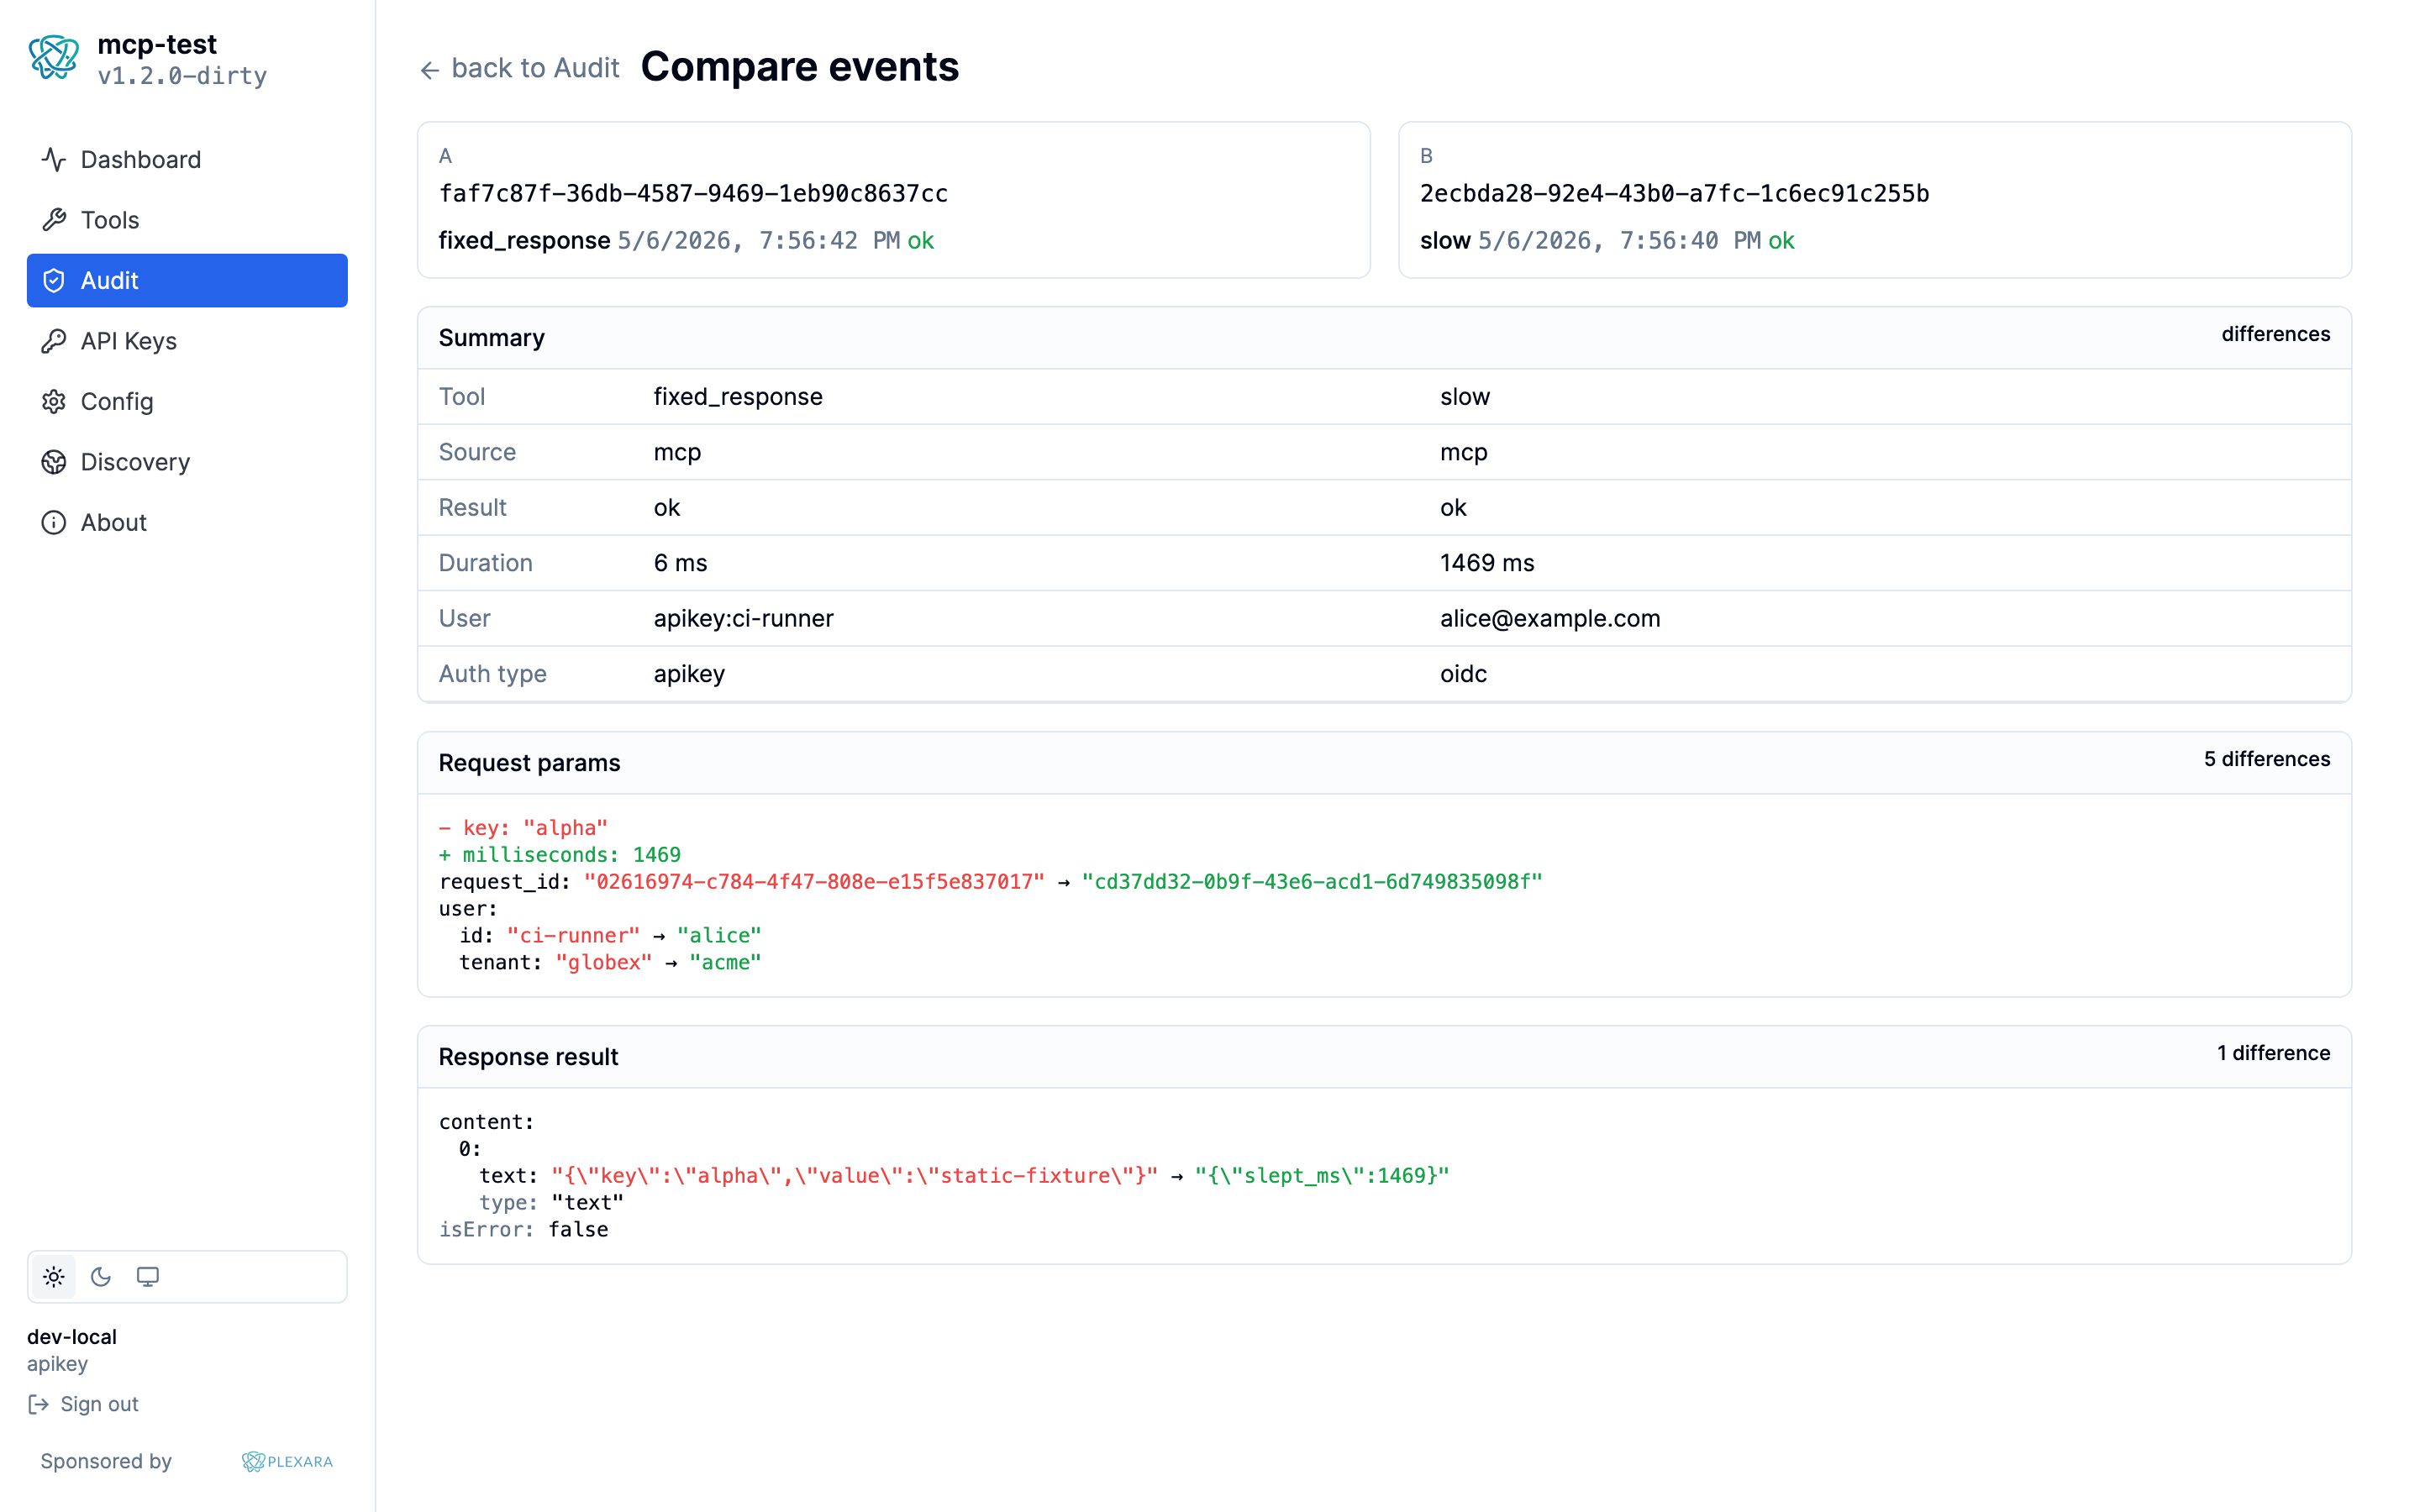
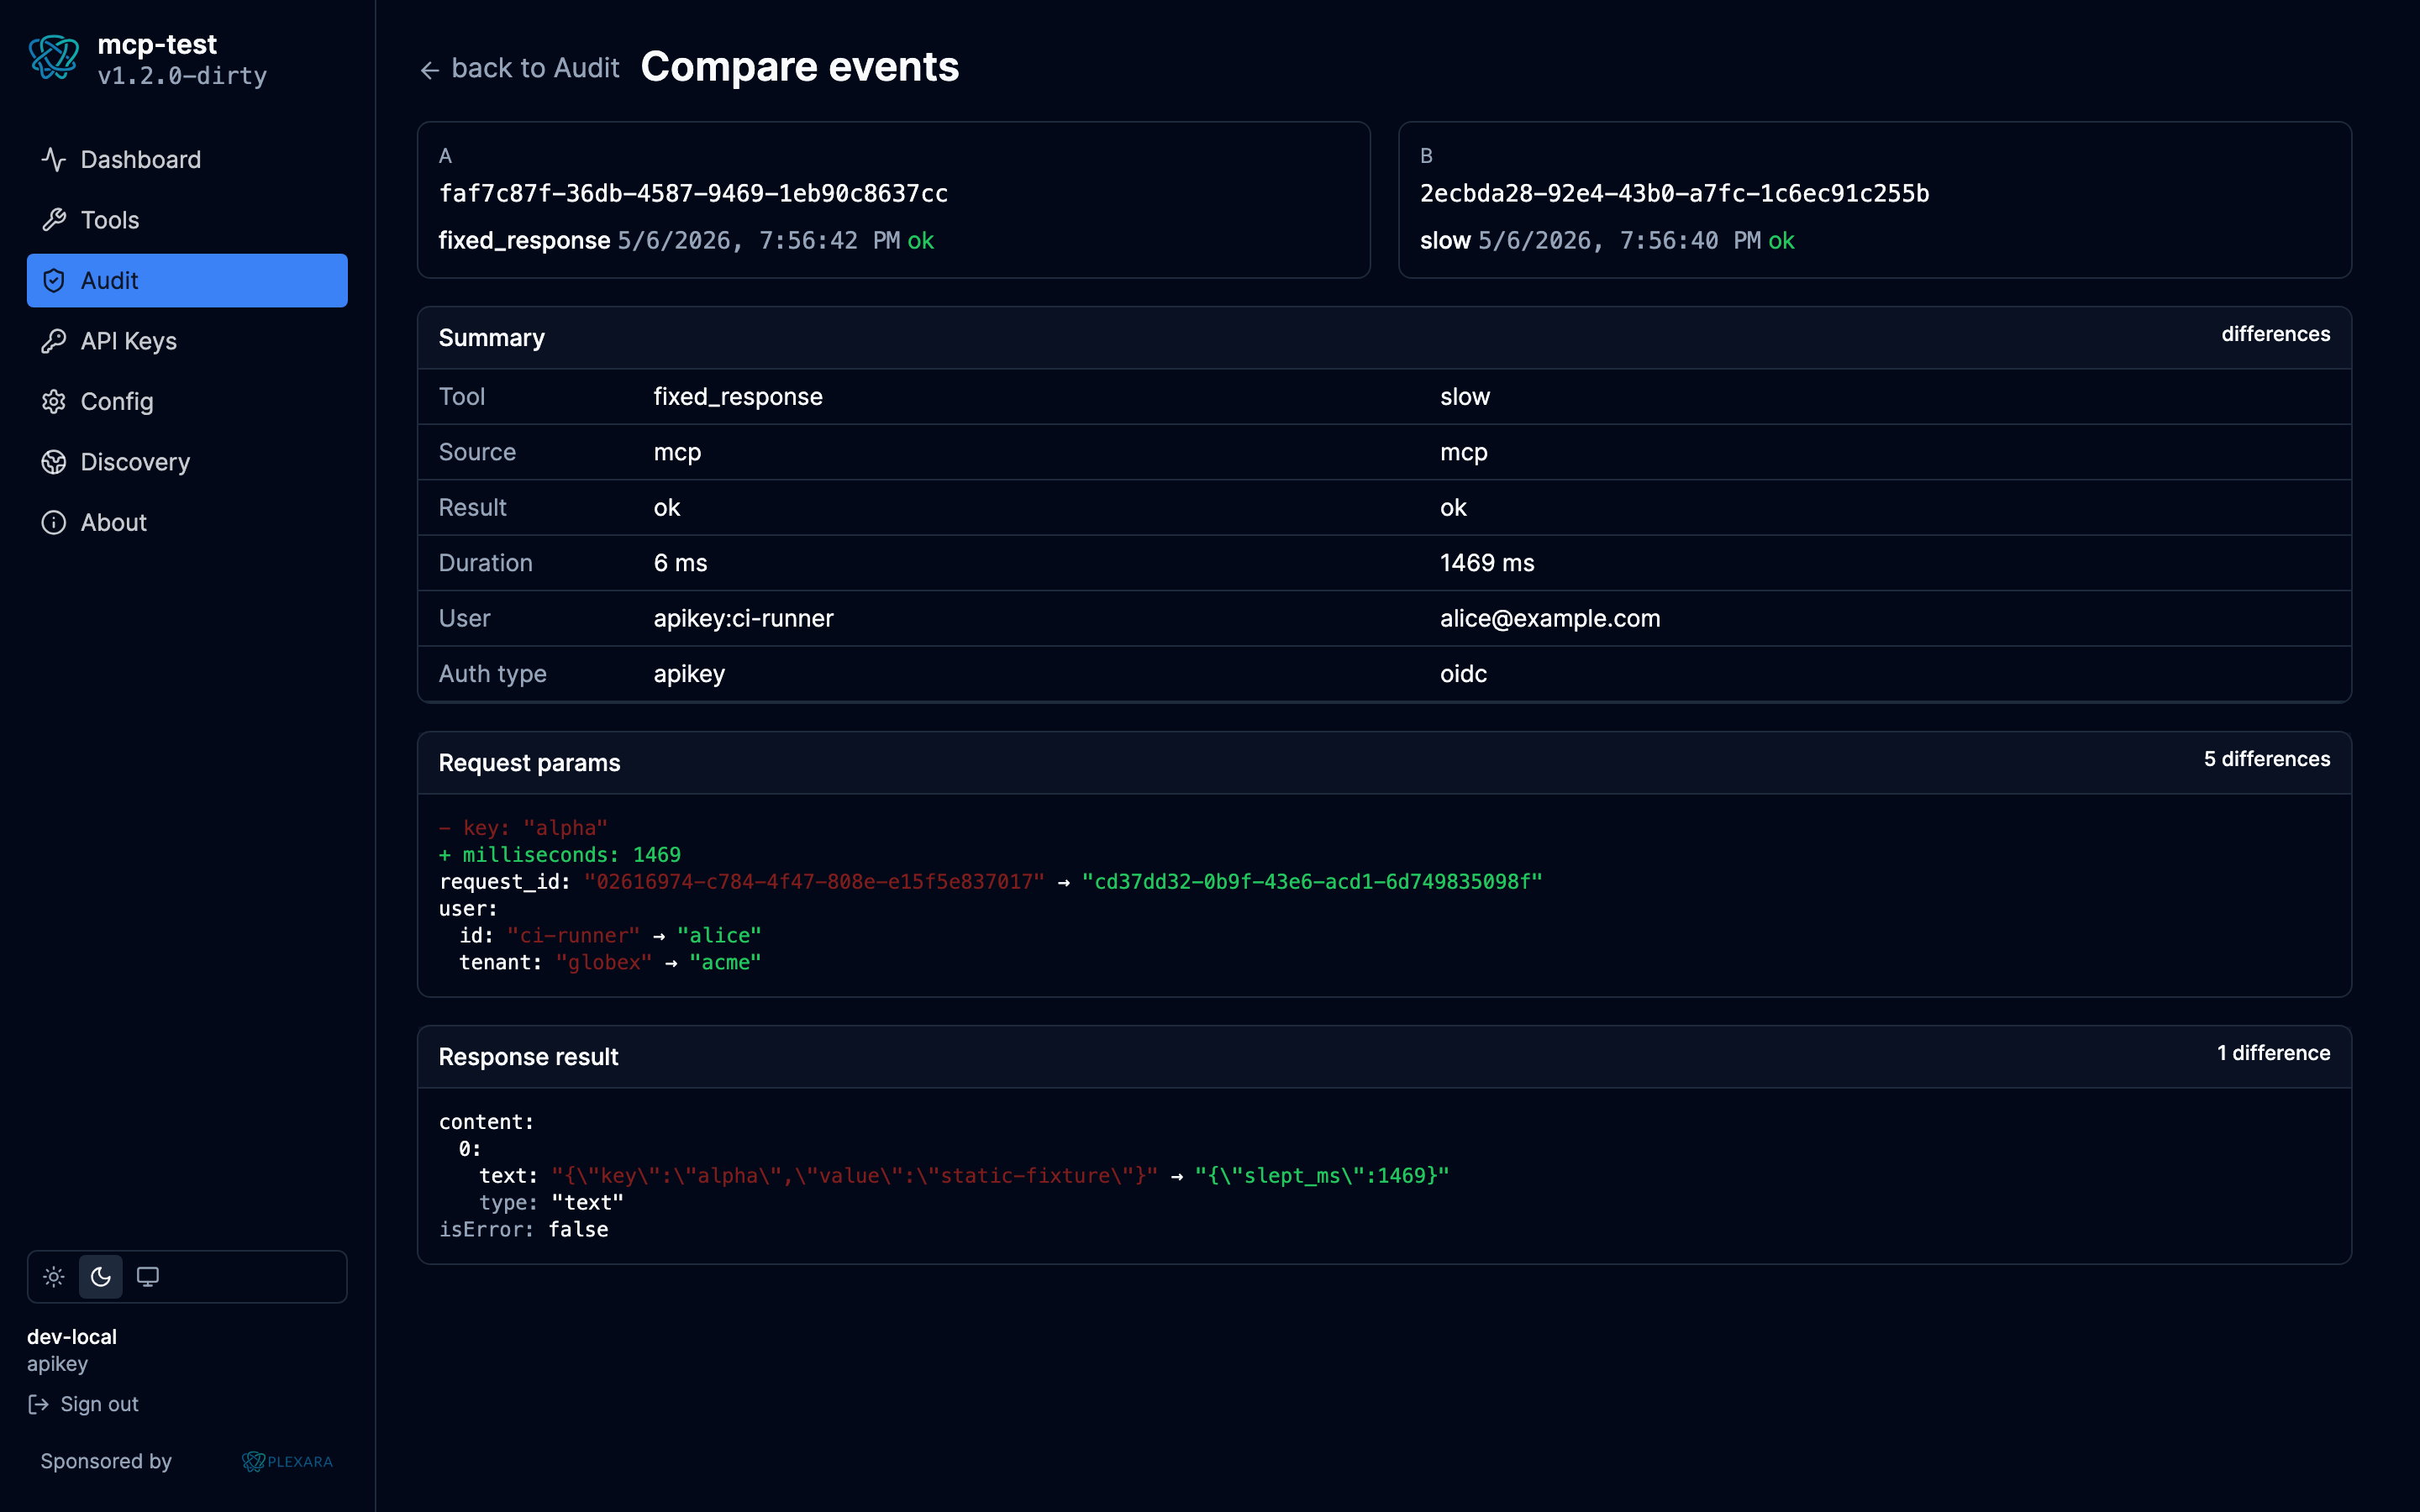
- A summary block (tool, source, result, duration, user, auth type) with diffs highlighted.
- Per-payload diff trees for
request_params,response_result,response_error, plus a count comparison for notifications. - Each leaf in the tree is annotated: same (muted), differ (warning color,
before → after), only-in-A (red-), only-in-B (green+).
The diff is JSON-path-aware: it walks objects and arrays by key/index instead of doing a text diff, so reordered keys (a Postgres read returning fields in any order) don't show as changes, and a string-vs-object swap appears as one diff at the path it happened, not as a wall of red lines.
Common compare workflows:
- A successful call and a failed call with the "same" arguments. The summary highlights
Result; the response trees show what differed in the tool's output. - Two captures of the same tool name spanning a deploy. Use the comparison to sanity-check that a refactor didn't change the response shape.
- A replay against its original. The drawer has a quick path: open the replay row, the drawer's Overview tab shows
Replayed from: <id>; navigate to that row, stash, then back to the replay row, stash, then Compare.
5. Filter via JSONB paths
The Audit page has a JSONB filters toggle that opens an editor for the path-aware filters the server compiles to JSONB containment queries. Operators routinely live with these set:
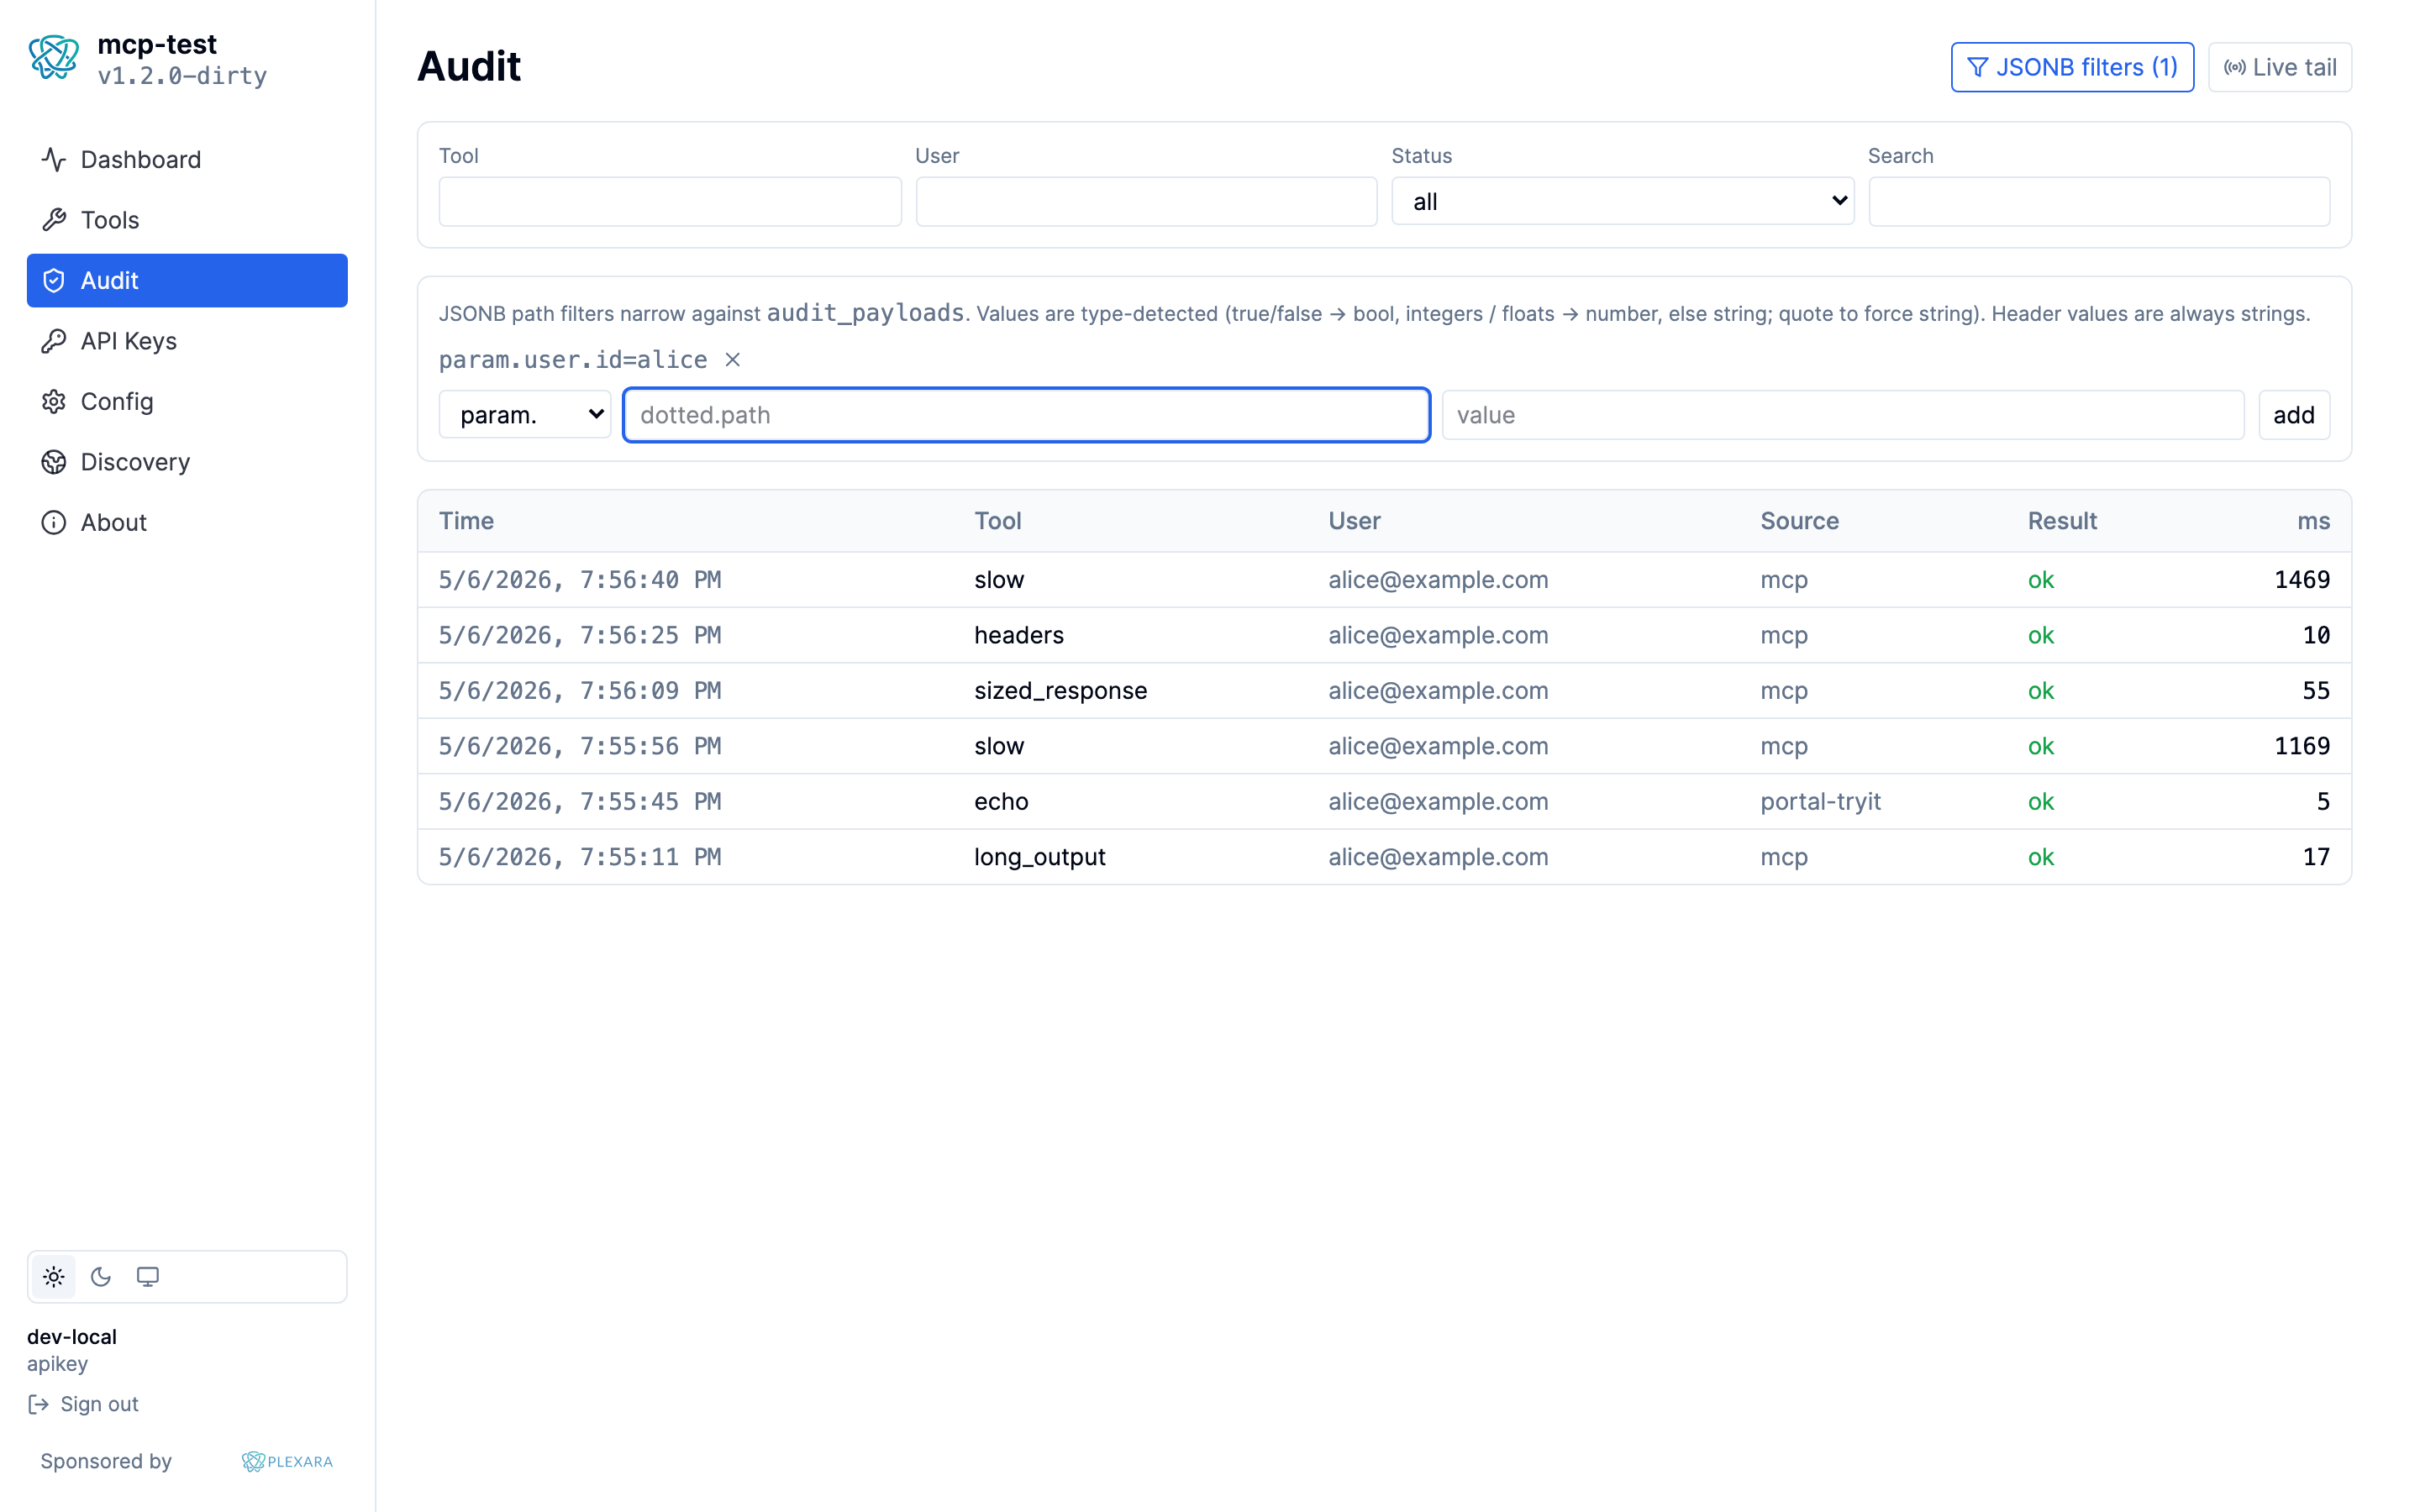
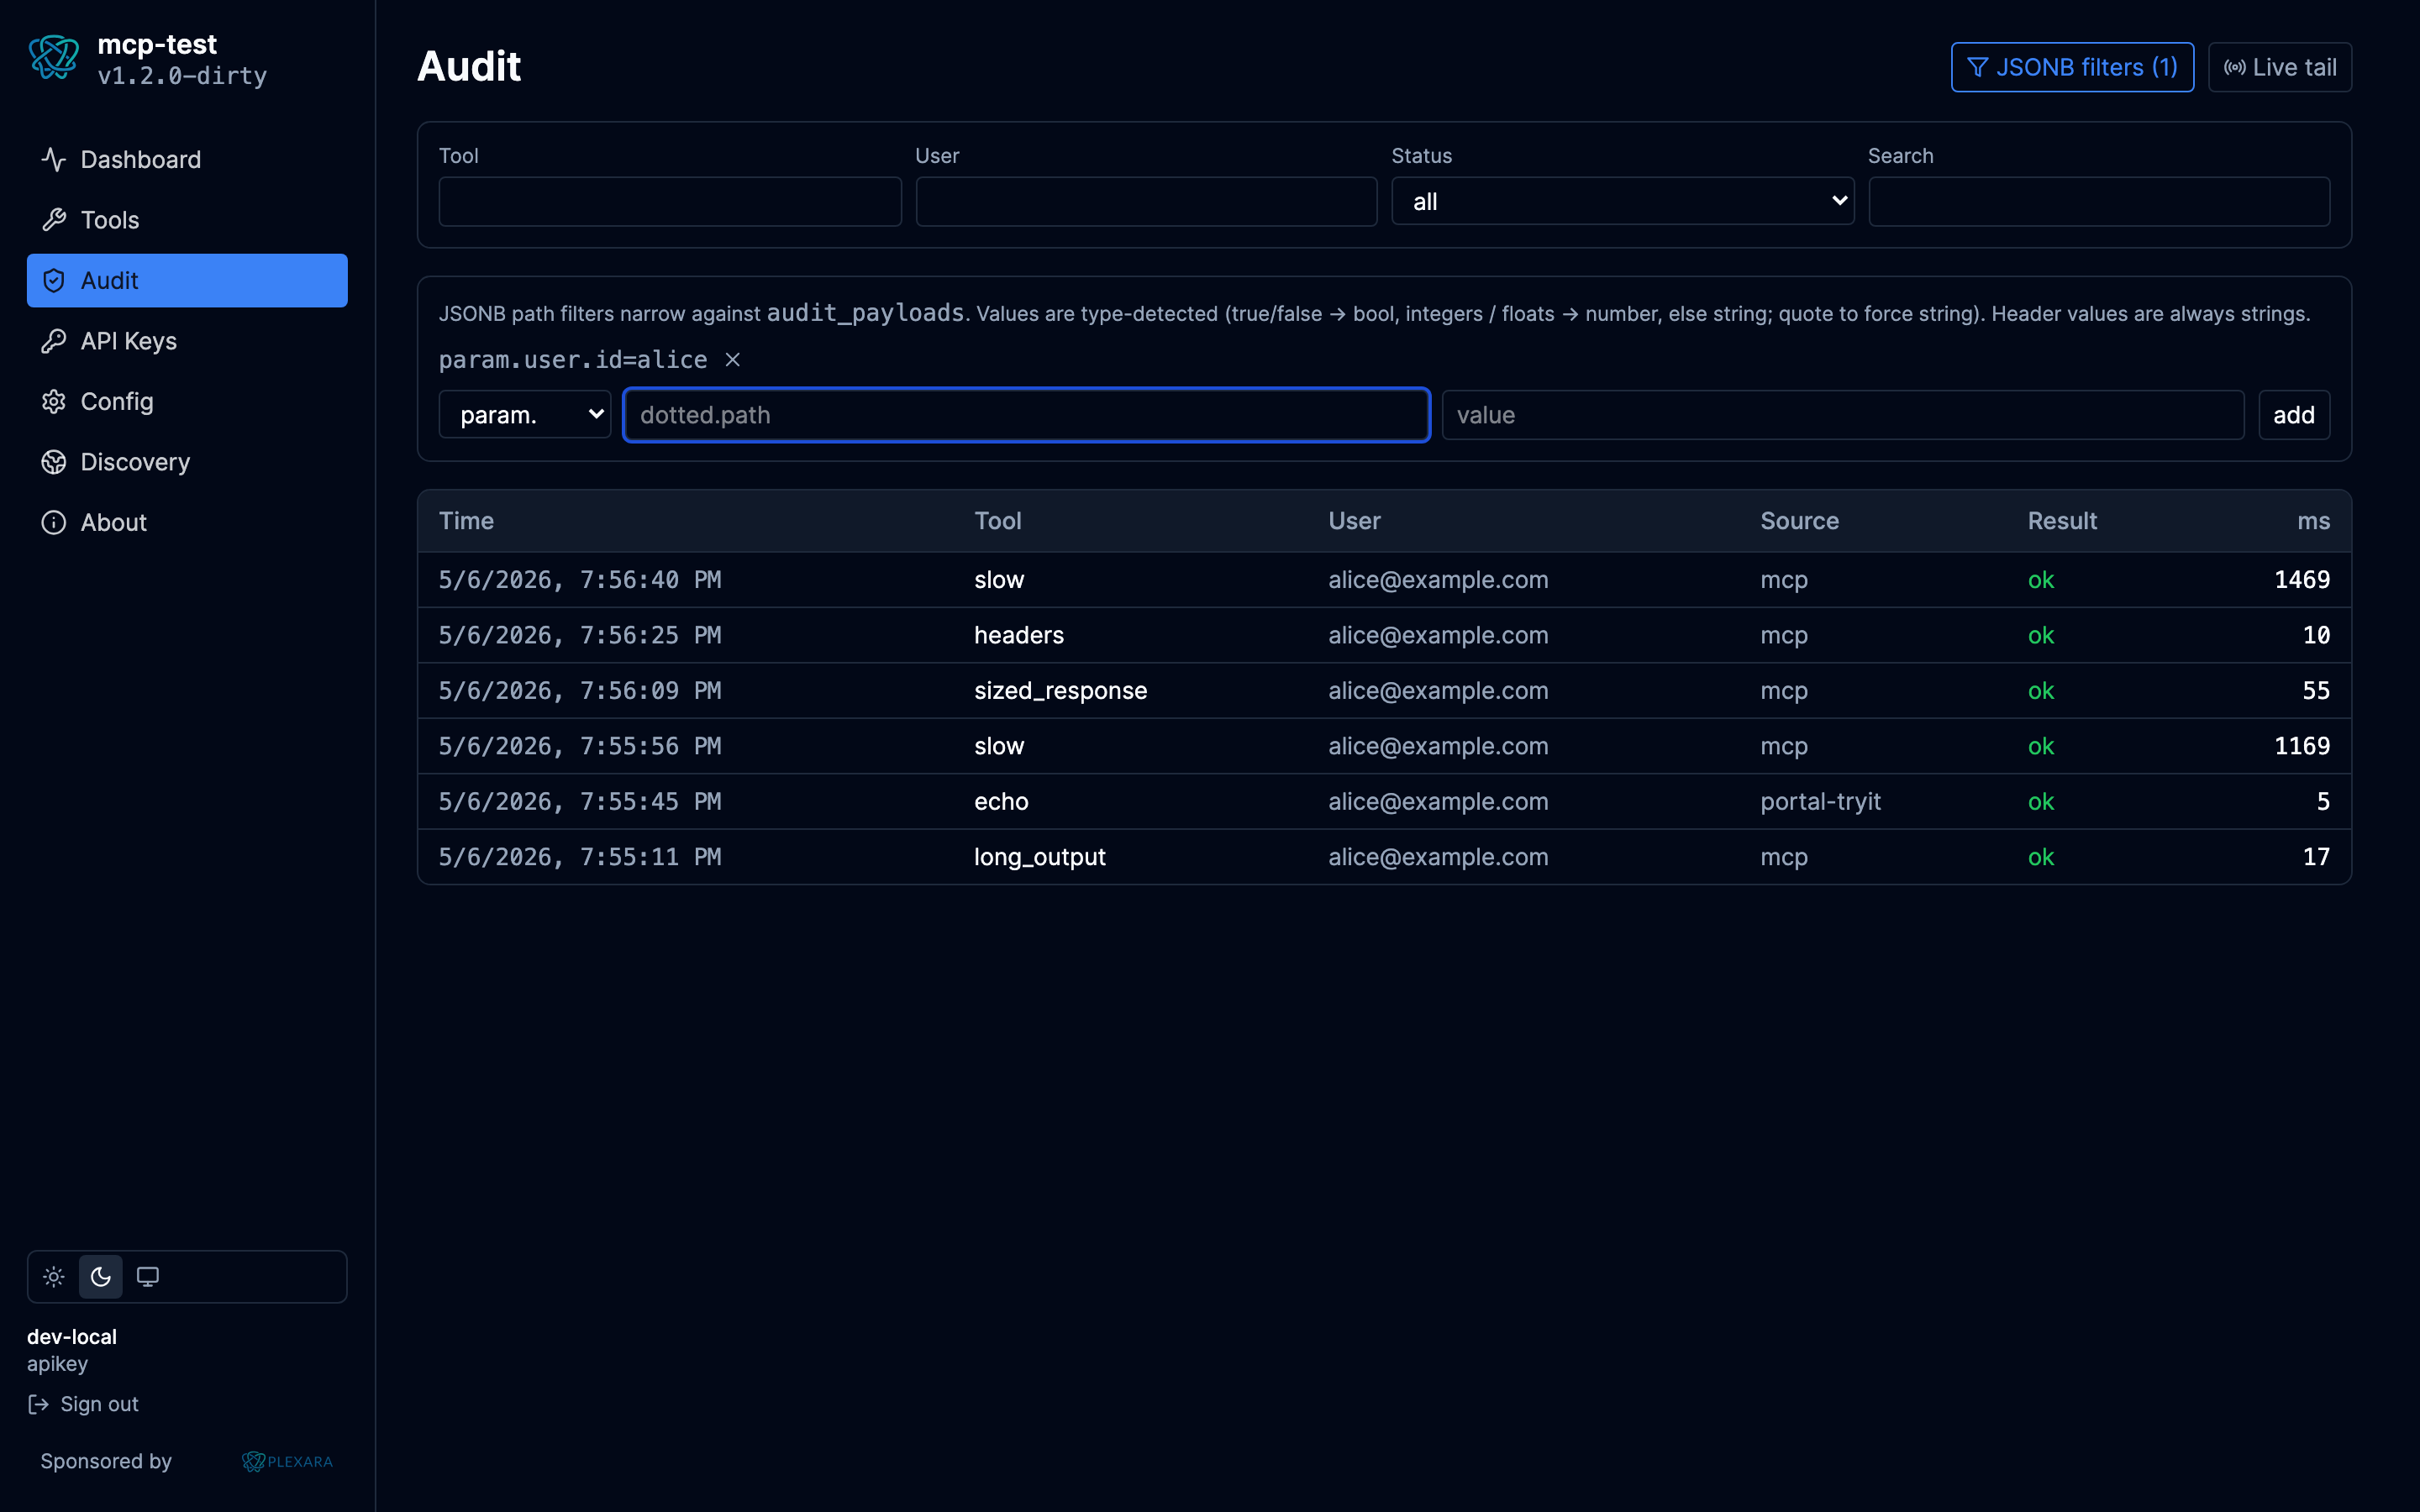
param.user.id=alice: every call where the request param at the dotted pathuser.idequalsalice.response.isError=true: every call whose response hadIsError=true(matches the JSON literaltrue, not the string"true"; values are type-detected).header.User-Agent=curl/8.0: every call from a specific User-Agent. Header names are canonicalized (user-agentmatchesUser-Agent).has=response_error: every call that recorded a transport-level error.has=notifications: every call that fired any notification.
Filters are AND-combined with each other and with the indexed-column filters (tool, user, success, etc.). They run against audit_payloads via EXISTS subqueries that hit the existing GIN indexes on request_params and response_result; request_headers is unindexed today so pair header.* with a time-range filter on busy deployments.
Quoting forces strings. ?param.code=200 matches the JSON number 200; ?param.code="200" matches the JSON string "200". Header values are always strings; type-detection does not apply there.
6. Live tail
The Live tail toggle on the Audit page opens an SSE connection to /api/v1/portal/audit/stream. New audit events appear in a fixed-cap most-recent-first list (cap 20) above the table as they're written; clicking one opens the drawer. The table itself stays a historical-filter view so the live tail doesn't blow away your filtered context.
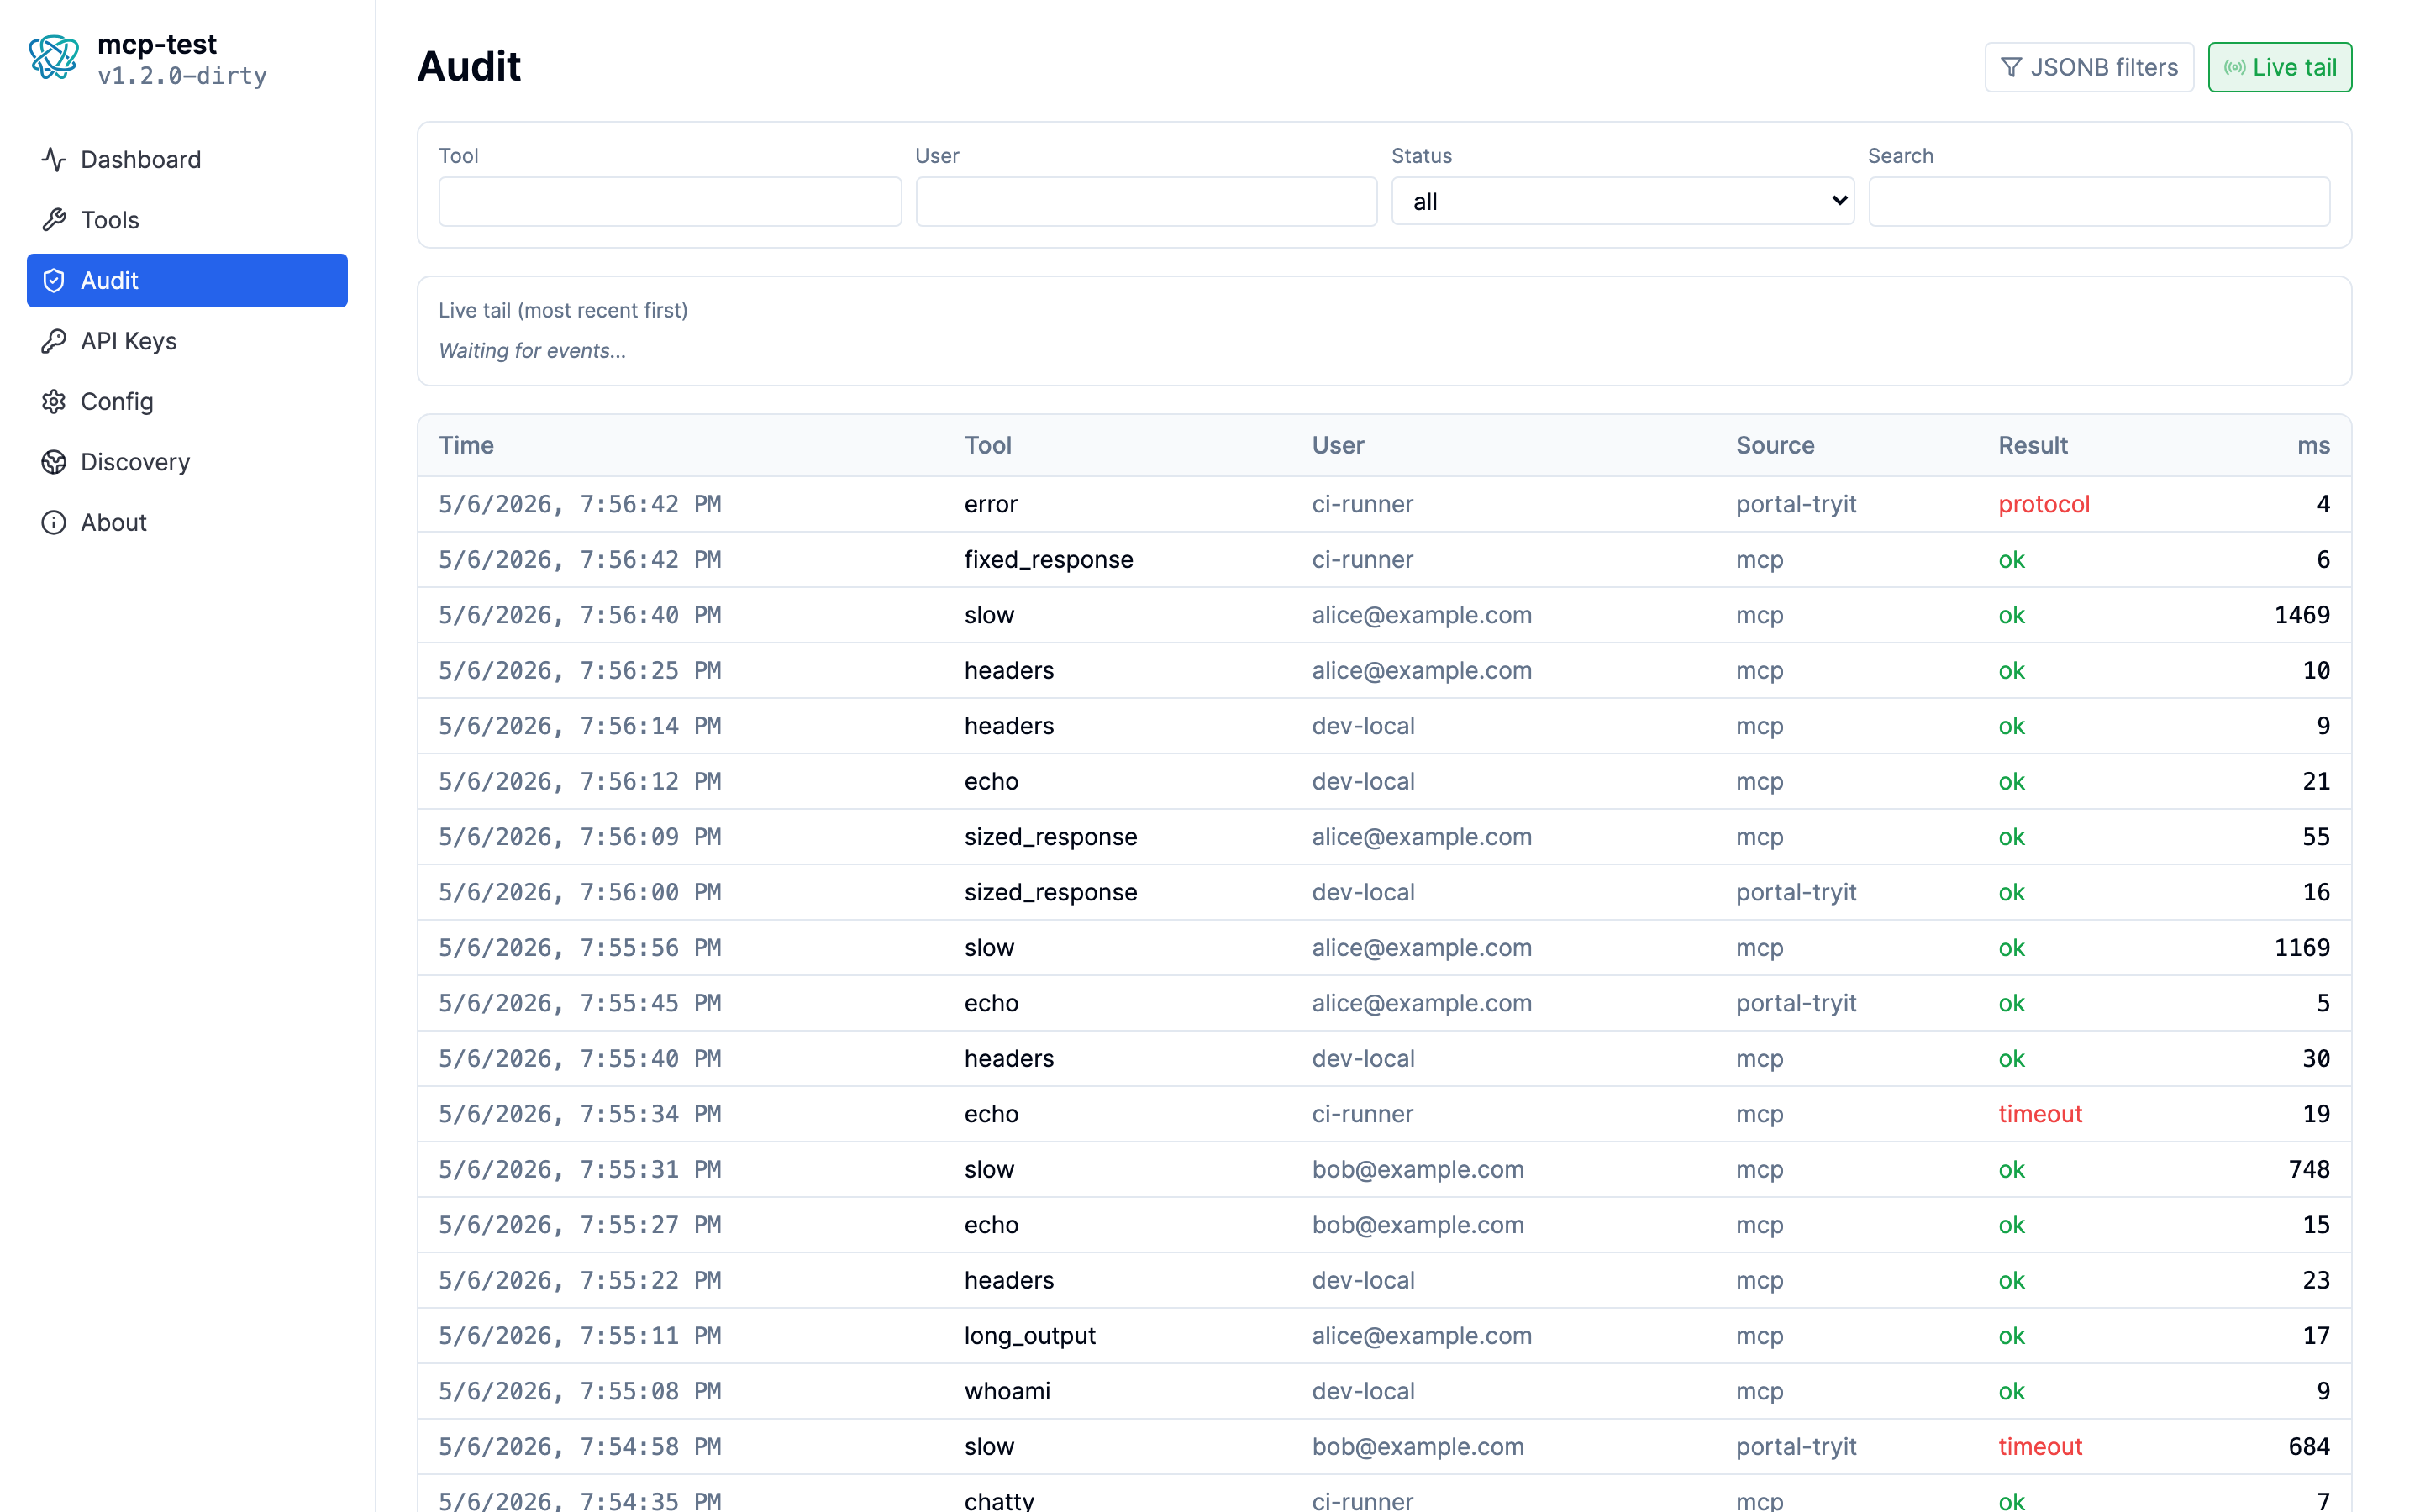
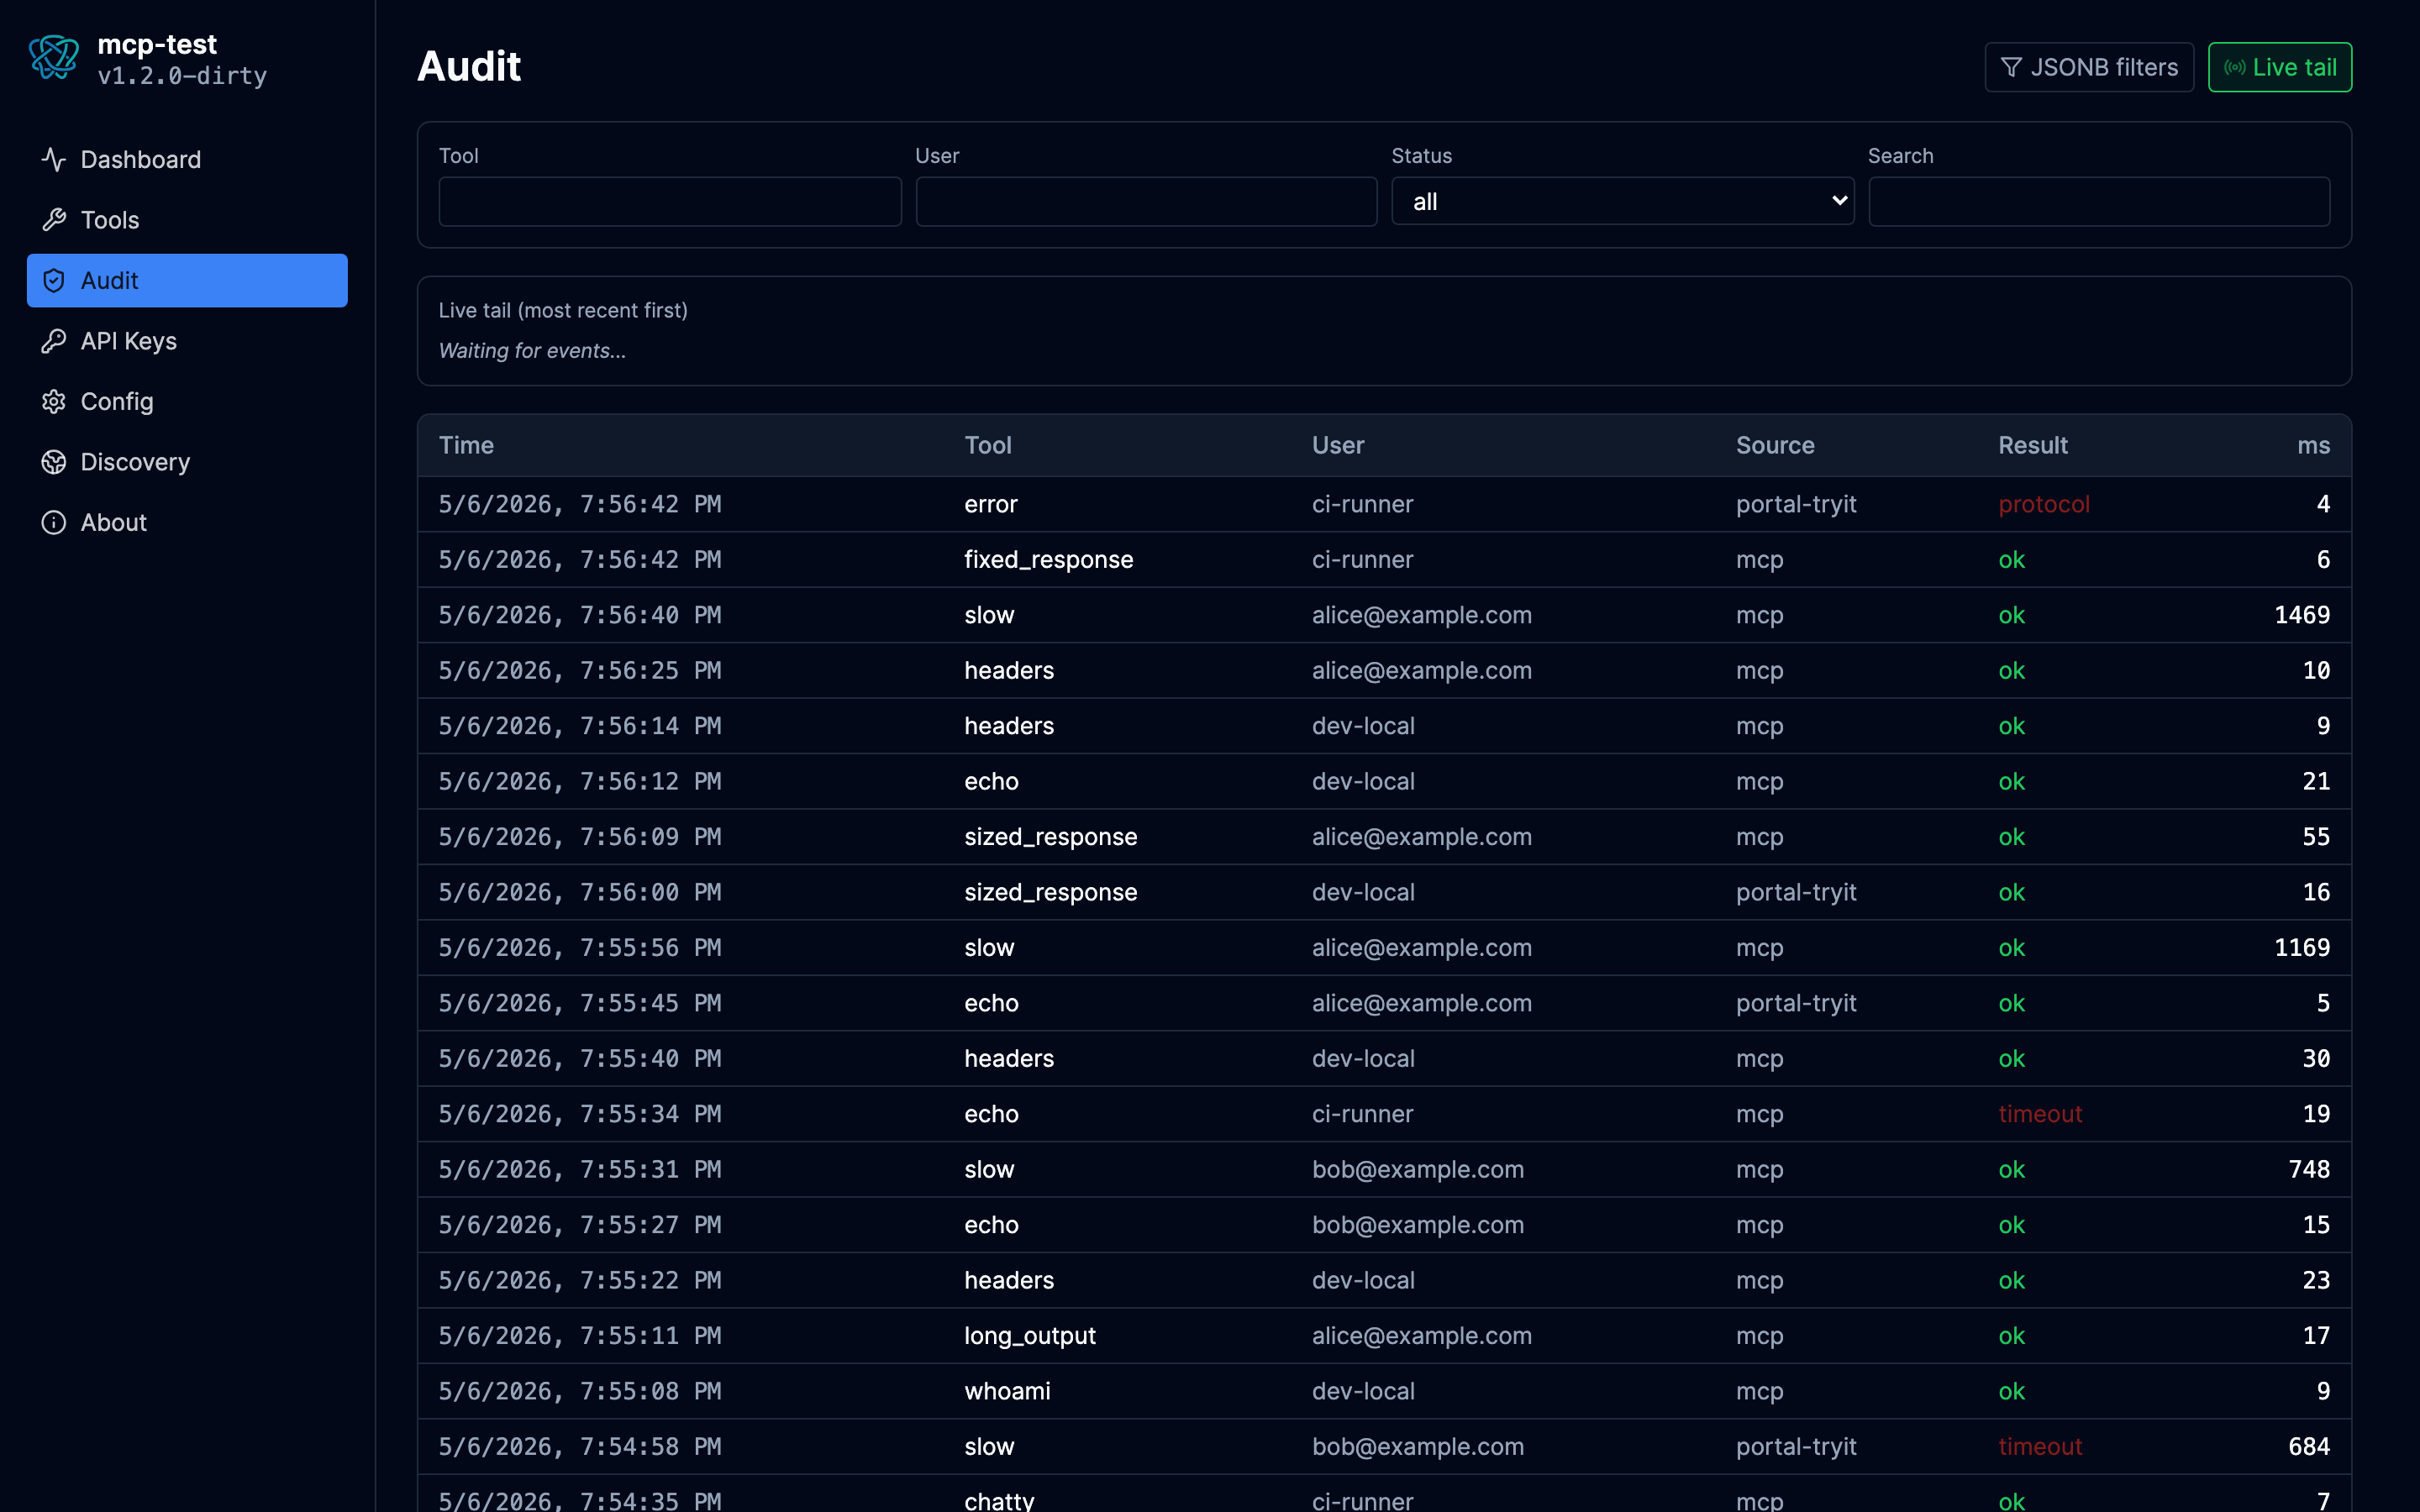
The stream sends an opening : connected comment on connect, an event: audit\ndata: <json> per write, and a : keepalive comment every 30 seconds. Slow consumers see per-subscriber drops; the producer never blocks.
7. Export
GET /api/v1/portal/audit/export?format=jsonl streams the filtered set as newline-delimited summary rows for offline analysis, ad-hoc ETL, or backups.
# Every error from the last 24h, piped through jq.
curl -H "X-API-Key: $KEY" \
  "$BASE/api/v1/portal/audit/export?success=false&from=$(date -u -v-24H +%FT%TZ)" \
  | jq -r '.tool_name + "\t" + .error_message'
The same JSONB filters work; combine ?success=false&has=notifications&from=... to scope a backfill.
The export omits the captured payload from each line; if you need the full envelope, follow up with /audit/events/{id} per event. The endpoint is currently capped at 100,000 rows per request and truncates at the cap with no in-band marker; verify the row count against your filter window and tighten if you hit the ceiling. (Future versions may emit a sentinel line or trailer; do not rely on the current silent-truncation behavior.)
End-to-end example
The shortest path from "a call broke" to a written-up bug report:
- Find the failure. Audit page, set Status=
error, glance at the table. - Understand it. Click the row. Overview shows the tool + duration; Response shows the
response_error.category+ message; Notifications shows what the tool got partway through before failing. - Reproduce it. Click Replay. New row in the table tagged
portal-replay. Open it; if it failed the same way, you have a deterministic repro. - Compare. Stash the current failed event via the drawer's Compare button. Open a healthy past call of the same tool, stash that. Compare opens both side-by-side; the Response tree highlights what changed.
- Hand it off. Copy the event id (from the URL
?id=or the drawer's id field) into the bug report. The recipient navigates/portal/audit?id=<id>and lands on the same drawer.
Reference
- HTTP endpoints:
docs/reference/http-api.md - Audit schema and retention:
docs/operations/audit.md - v1.1.0 baseline + v1.1.1 schema follow-up: see the audit.md "Two-table layout" section.